Observation — Reading real HTTP with curl and DevTools
In curl -v, > is the request you sent and < is the response you received. -I for headers only, -L to follow redirects. Together with the DevTools Network tab, apply the three-part reading to the real thing.
From textbook HTTP to the real thing
Across the past five chapters you assembled the reading tools: the correspondence format, the verbs, the reply numbers, the margin notes, and the cache. In this chapter we point them at the real thing. Two instruments — the command-line tool curl, and the browser's developer tools.
Their roles differ slightly. curl is a microscope that sends a single request in its bare form and shows you the raw text; the developer tools are a radar surveying the dozens of requests a whole page fires. To inspect one request deeply, curl; to hunt anomalies across the whole, the Network tab.
curl -v — the correspondence streams by as-is
Run curl -v https://example.com/ (-v for verbose) and, along with the progress of the connection, the very skeleton read in Chapter 1 streams across the screen. The key to reading it is the symbol at the start of each line.
GET / HTTP/1.1) and request headersHTTP/1.1 200 OK) and response headersIn other words: the > block for "what was asked", the first < line for "how it went", the following < lines for "conditions and notes" — the three-part set is lined up exactly as-is.
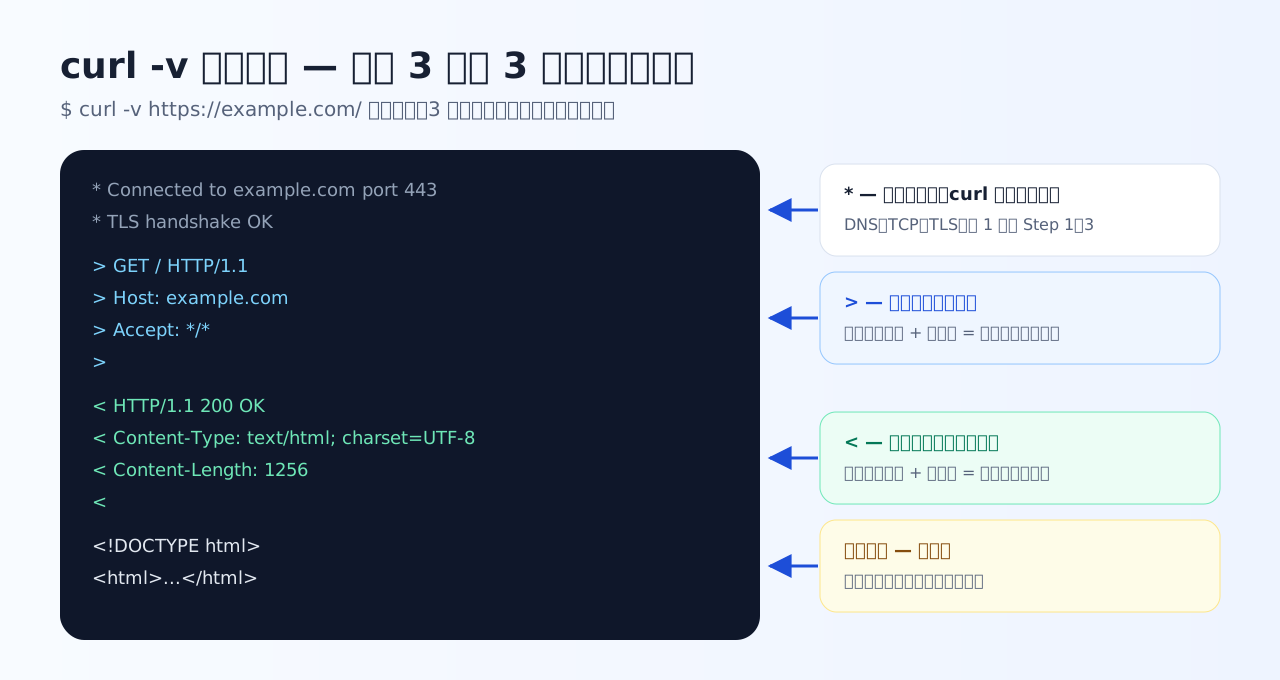
An annotated view of curl -v output. Once you can tell the three symbols apart (* / > / <), however long the output, you can cut it into three blocks: 'preparation', 'what was asked', and 'what came back'.
-I and -L — headers only, and through to the destination
Let us pin down the two options that come up constantly in investigations.
curl -I (capital i) means "headers only, please". It requests with the HEAD method (Chapter 2), so only the status line and headers come back. You can check margin notes like Content-Type, Content-Length, and Cache-Control without downloading the body.
$ curl -I https://example.com/
HTTP/1.1 200 OK
Content-Type: text/html; charset=UTF-8
Content-Length: 1256
Cache-Control: max-age=86400
curl -L means "please follow through to the destination". By default curl does not follow redirects and shows you the 301/302 reply as-is. That honesty is convenient in investigations — "where is it trying to send me" can be checked in the Location header. Add -L when you want the final contents too. Since the browser always does the -L equivalent automatically, you could say curl is where you first get to observe 'the redirect itself'.
Practice 6-1 — Reading curl output
The symbols of curl -v, and when to use -I and -L. The Chapter 1 skeleton appears as-is.
Q1. In the output of curl -v https://example.com/, which is the correct meaning of the leading > and <?
The arrows are the direction of travel. > goes from us to the server (sent = the request line and request headers), < from the server to us (received = the status line and response headers). The skeleton read in Chapter 1 appears exactly in these two kinds of lines. They are not symbols for error vs normal or encrypted vs plaintext.
Q2. You want to check a huge file's Content-Type and Content-Length without downloading the body. Which curl usage is most appropriate?
-I sends a HEAD request, and only headers come back (Chapter 2's HEAD gets its moment). -L follows redirects, -o saves the body to a file (the very download you wanted to avoid), and --data sends a POST — the opposite direction from the goal. 'I just want to see the headers' comes up constantly in investigations, so -I is worth getting into your hands.
Q3. Running curl https://example.com/old-page returned only a 301 response, without showing the page contents. Which option automatically follows the redirect and fetches the contents?
By default curl does not follow redirects and shows you the 301/302 response as-is (an honesty that is handy in investigations). Adding -L makes it automatically re-request the destination in the Location header until it fetches the final contents. -I is headers only, -v is verbose output, -s silences the progress display — none of them follow the redirect.
The DevTools Network tab — harmless once the columns make sense
Open the developer tools in the browser (F12 in most environments), pick the Network tab, and reload the page: every request that page fired lines up, one row each. Four columns to read first.
(disk cache) / (memory cache), no request went to the server (Chapter 5's fresh exit). Rows with 304 should show transfers of a few hundred bytesClick a row and the Headers panel opens, showing the request line, the status line, and every header — that is, the very text this course has been reading.
One more thing to remember: the Disable cache checkbox. It disables the cache only while DevTools is open, forcing everything to be fetched from the server. When "my fix is not showing up", it is the fastest tool for separating 'the cache's fault' from 'genuinely not deployed'.
A typical observation procedure — applying the three-part set to the real thing
Here is the procedure, in this course's pattern, for when someone says "the page looks wrong" or "the API is failing".
Step 4 works because curl sends one pristine request. If a problem reproducing in the browser does not reproduce in curl, suspect browser-side state such as cache or Cookies — and if it reproduces in curl too, you can narrow it to the server side.
Practice 6-2 — Reading the Network tab
Reading the same three-part set in the browser's developer tools. How caching shows up is the key.
Q4. In the DevTools Network tab, a CSS file's row shows (disk cache) in the Size column. Which is the correct meaning?
(disk cache) or (memory cache) in the Size column is Chapter 5's 'fresh — not even a request goes out' exit showing up in real life. It was read from the browser's own cache, not the server. So when 'I fixed the server but nothing changed', this display all but confirms the cause. It is not about the server's disk or file corruption.
Q5. Which is the correct purpose of checking 'Disable cache' in the Network tab?
Disable cache means 'while DevTools is open, do not use the browser cache'. You can verify whether your revised CSS or JS is actually being served, without the cache getting in the way. Since the cache is skipped, rendering actually gets slower, and server-side or CDN caches are untouched. It is a staple during development — and remember it reverts once you close DevTools.
Q6. You received a report that 'the page renders oddly' and opened the Network tab. Following this course's pattern, which is the most appropriate first move of observation?
This is the three-part reading in action. First read the failed row's 'how did it go' (Status) and classify whose problem it is by the hundreds digit, then 'what was asked' (method and URL), and finally proceed to 'conditions and notes' (headers). Starting with reading every body or reinstalling is inefficient ordering, and the Time column is a performance tool — the first move in error investigation is the status code.
What to take from this chapter
- In curl -v, > = what you sent, < = what you received, * = connection progress. The three-part set lines up as-is
- -I is headers only (HEAD), -L follows redirects to the end. The default honesty of not following redirects pays off in investigations
- Read the Network tab in the order Status → method and URL → Headers.
(disk cache)in the Size column is the sign that "no request went out" - Reproduces in the browser but not in curl → browser-side state; reproduces in curl too → server side — the standard split
All the tools are assembled. The final chapter is the capstone — eight practical-style cases, read through with this course's pattern.